Predator and Prey Cycle Lab Experiment
Over the summer, I learned about predator and prey cycles through the ecology unit. For the first assignment in this quarter’s science unit, I performed an experiment which simulated the relationship between predators and prey. This experiment does not require any lab equipment and is both fun and easy to accomplish.
What Was the Purpose of the Experiment: The purpose of this experiment was to create a simulation of the relationship between predators and prey in a closed ecosystem.
What Was My Hypothesis: My hypothesis was that the number of both animal groups would build up quickly, resulting in an unbalance that would cripple both populations. This would repeat again and again, only less strong each time. It would eventually even out when either by chance or through math a balance would be created between the predators and prey.
What Materials Did I Need For This Experiment: The experiment required a roll of non-transparent tape, note cards, toothpicks, and a pair of scissors. I also needed a sheet of paper and a pencil or pen to record the data. The note cards were cut into six individual squares. The paper played the role as the predator and the toothpicks were the prey.
What Was the Procedure of This Experiment:
Step 1: Step one involved the creation of the simulation space. I used tape to mark the borders of a one square foot space. I recommend using the same sized space. Different sized fields will yield different results.
Step 2: Step two involved the first round. I laid out six toothpicks on the field and threw a square of paper out on the space at random. At first, the square did not land on a toothpick. Because of this, I doubled all the toothpicks and removed the square from the game. If a square does land on a toothpick, remove the toothpick, double the square, and double the remaining toothpicks before recording the round’s data.
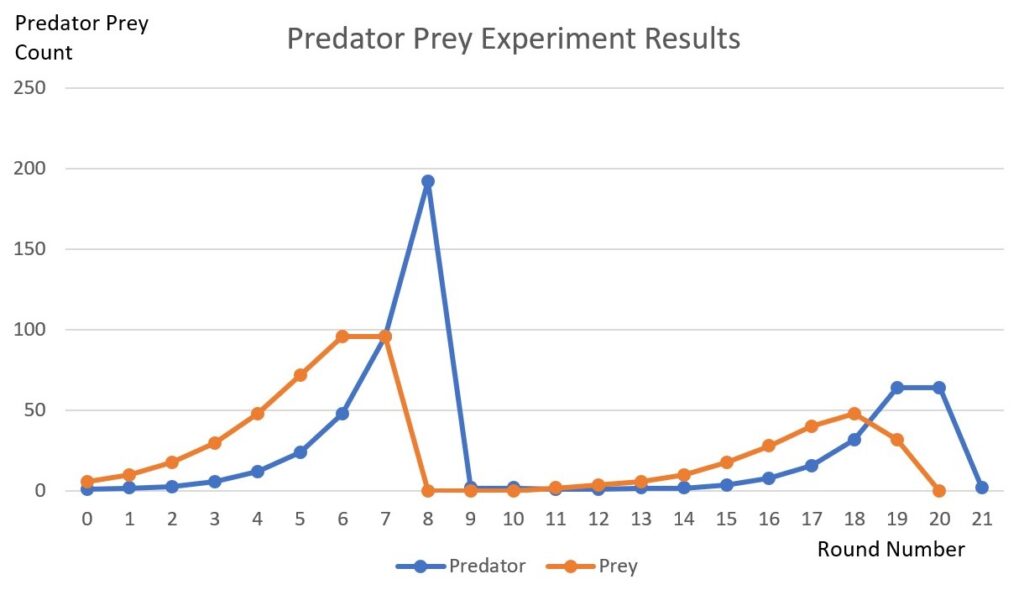
Step 3: As the rounds progressed, I repeated these steps. As the predator count increased, I threw every square out on the field during each round. If one landed on more than one prey, I only removed one toothpick. At the end of the round, I doubled the remaining predators. I repeated this for 21 rounds. I recommend doing the experiment for at least 20 rounds to accurately record the data.
Step 4: Note: If all predators or prey are removed from the space, restart with one each.

In the end, my hypothesis was correct. Early on when the probability of a square landing on a toothpick was low, the prey population expanded rapidly. With more of the board covered by toothpicks, it became easier for a square to land on one. This led to the predator population to grow, following the prey. When the predator and prey populations became equal, both were killed off. After restarting the game with one prey and one predator, this exact trend was repeated again. In conclusion my hypothesis was correct, although the experiment wasn’t carried on long enough to accurately predict the population trends. I believe that if the experiment was continued for significantly longer, you would eventually begin to see both populations even out, forming a balance.
The experiment also didn’t involve some crucial variables. Unlike the predators, which were required to eat prey to survive, the population of the prey was not controlled by a limited food source. Having a limited herbivore food source would prevent an explosive boost in prey population. I also didn’t take into consideration the differing reproductive rates of the predators and prey. Prey often times gain survival defenses through evolution. This can include speed, defensive shells, camouflage, or a fast rate of reproduction. I did not consider that the prey would increase their population much quicker than the predators. To conclude, I believe this was a successful basic simulation, however there were many variables I overlooked which could potentially have interfered with the data.